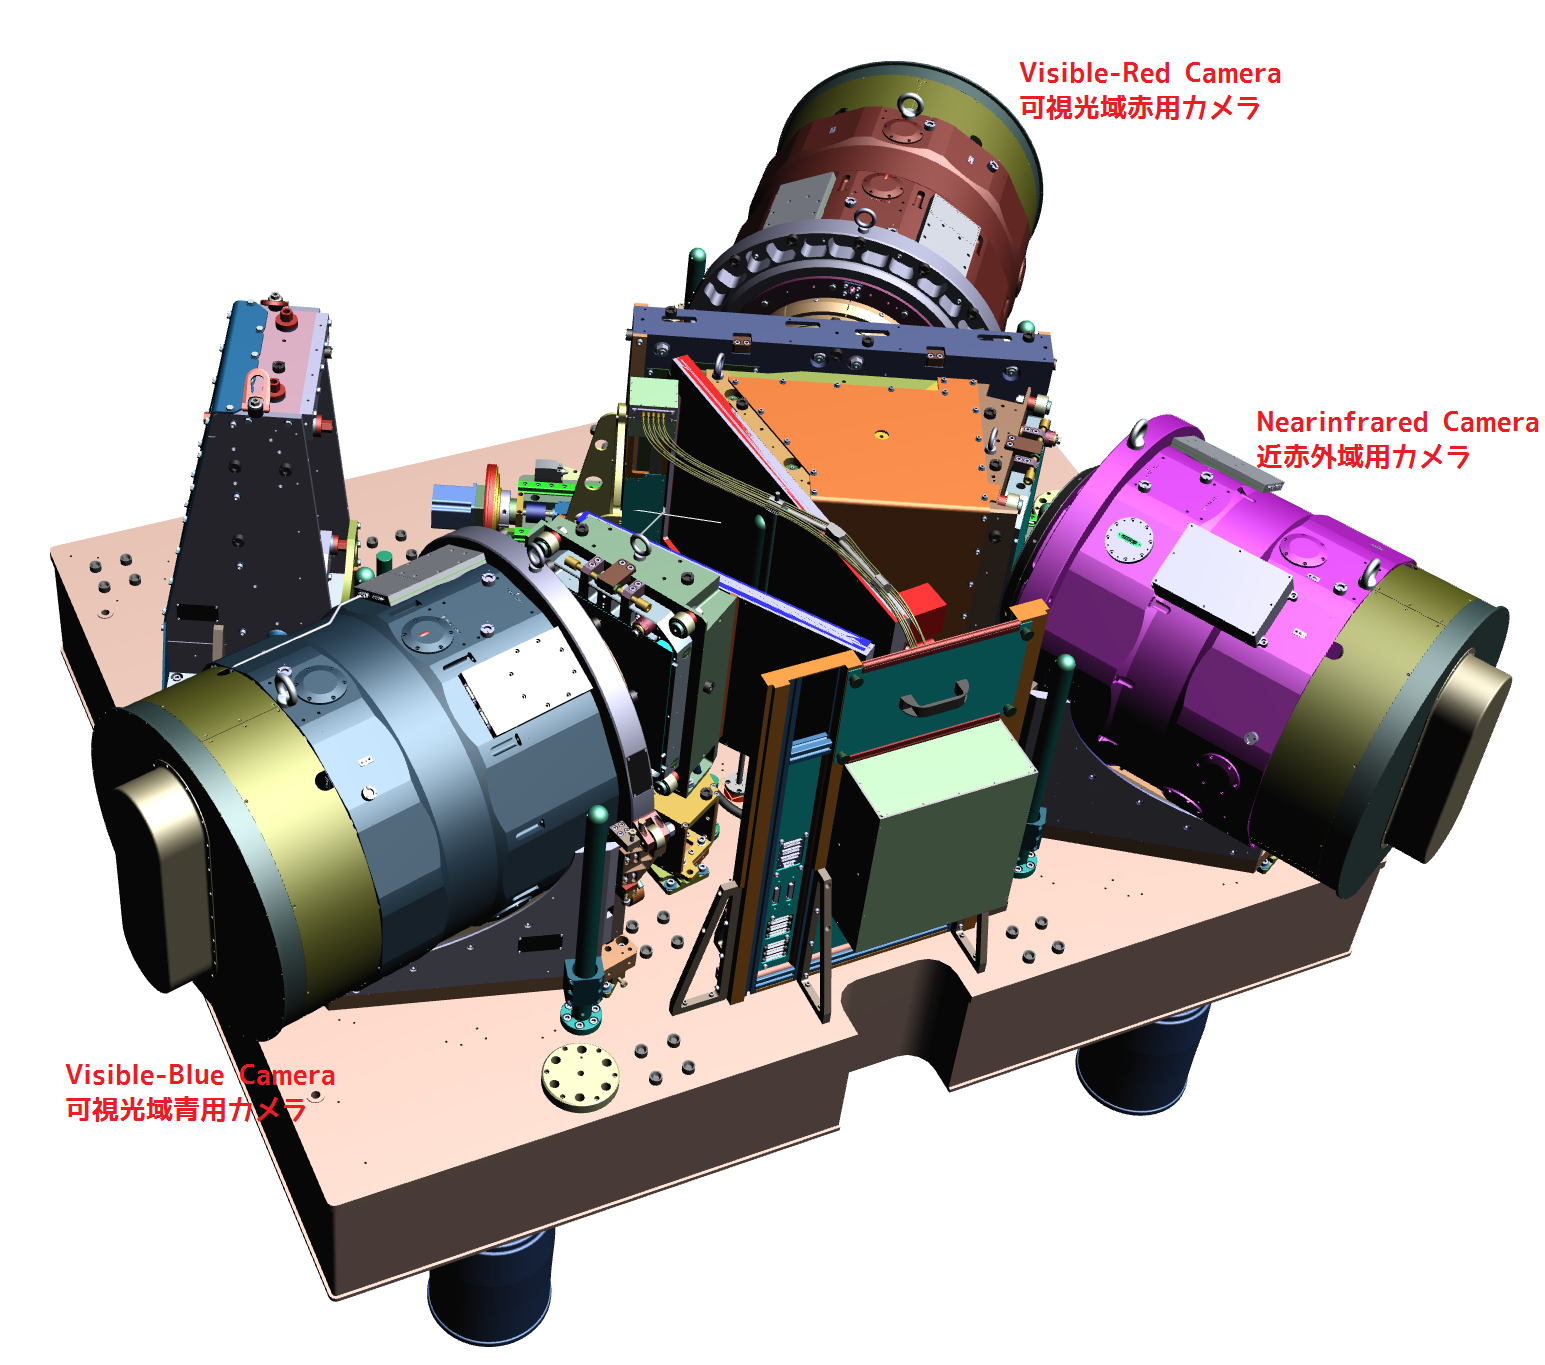
About one month has already passed since (western) new year. PFS project is keeping the efforts on development in this year to complete the instrument and start scientific operation. In the end of 2023, the four spectrograph modules were finally integrated at Subaru Telescope, National Astronomical Observatory of Japan (NAOJ), except for one near-infrared camera. After it, we carried out on-telescope test by connecting the four spectrographs to Prime Focus Instrument (PFI) [Note].
One PFS spectrograph module covers 600 spectra. The 2D image taken by each camera has 600 curves, from which individual lines are extracted to get the spectra. The various process is required to extract each spectrum. Princeton University and NAOJ are responsible to develop software modules to process 2D images to make spectra. To extract spectra, two kinds of the calibration data are important one is called “detector map” to determine the wavelength and fiber position on the 2D image, and the other is called “fiber profile” to determine the distribution of the fiber brightness on the image. We took these calibration data for all 11 cameras installed on the telescope.
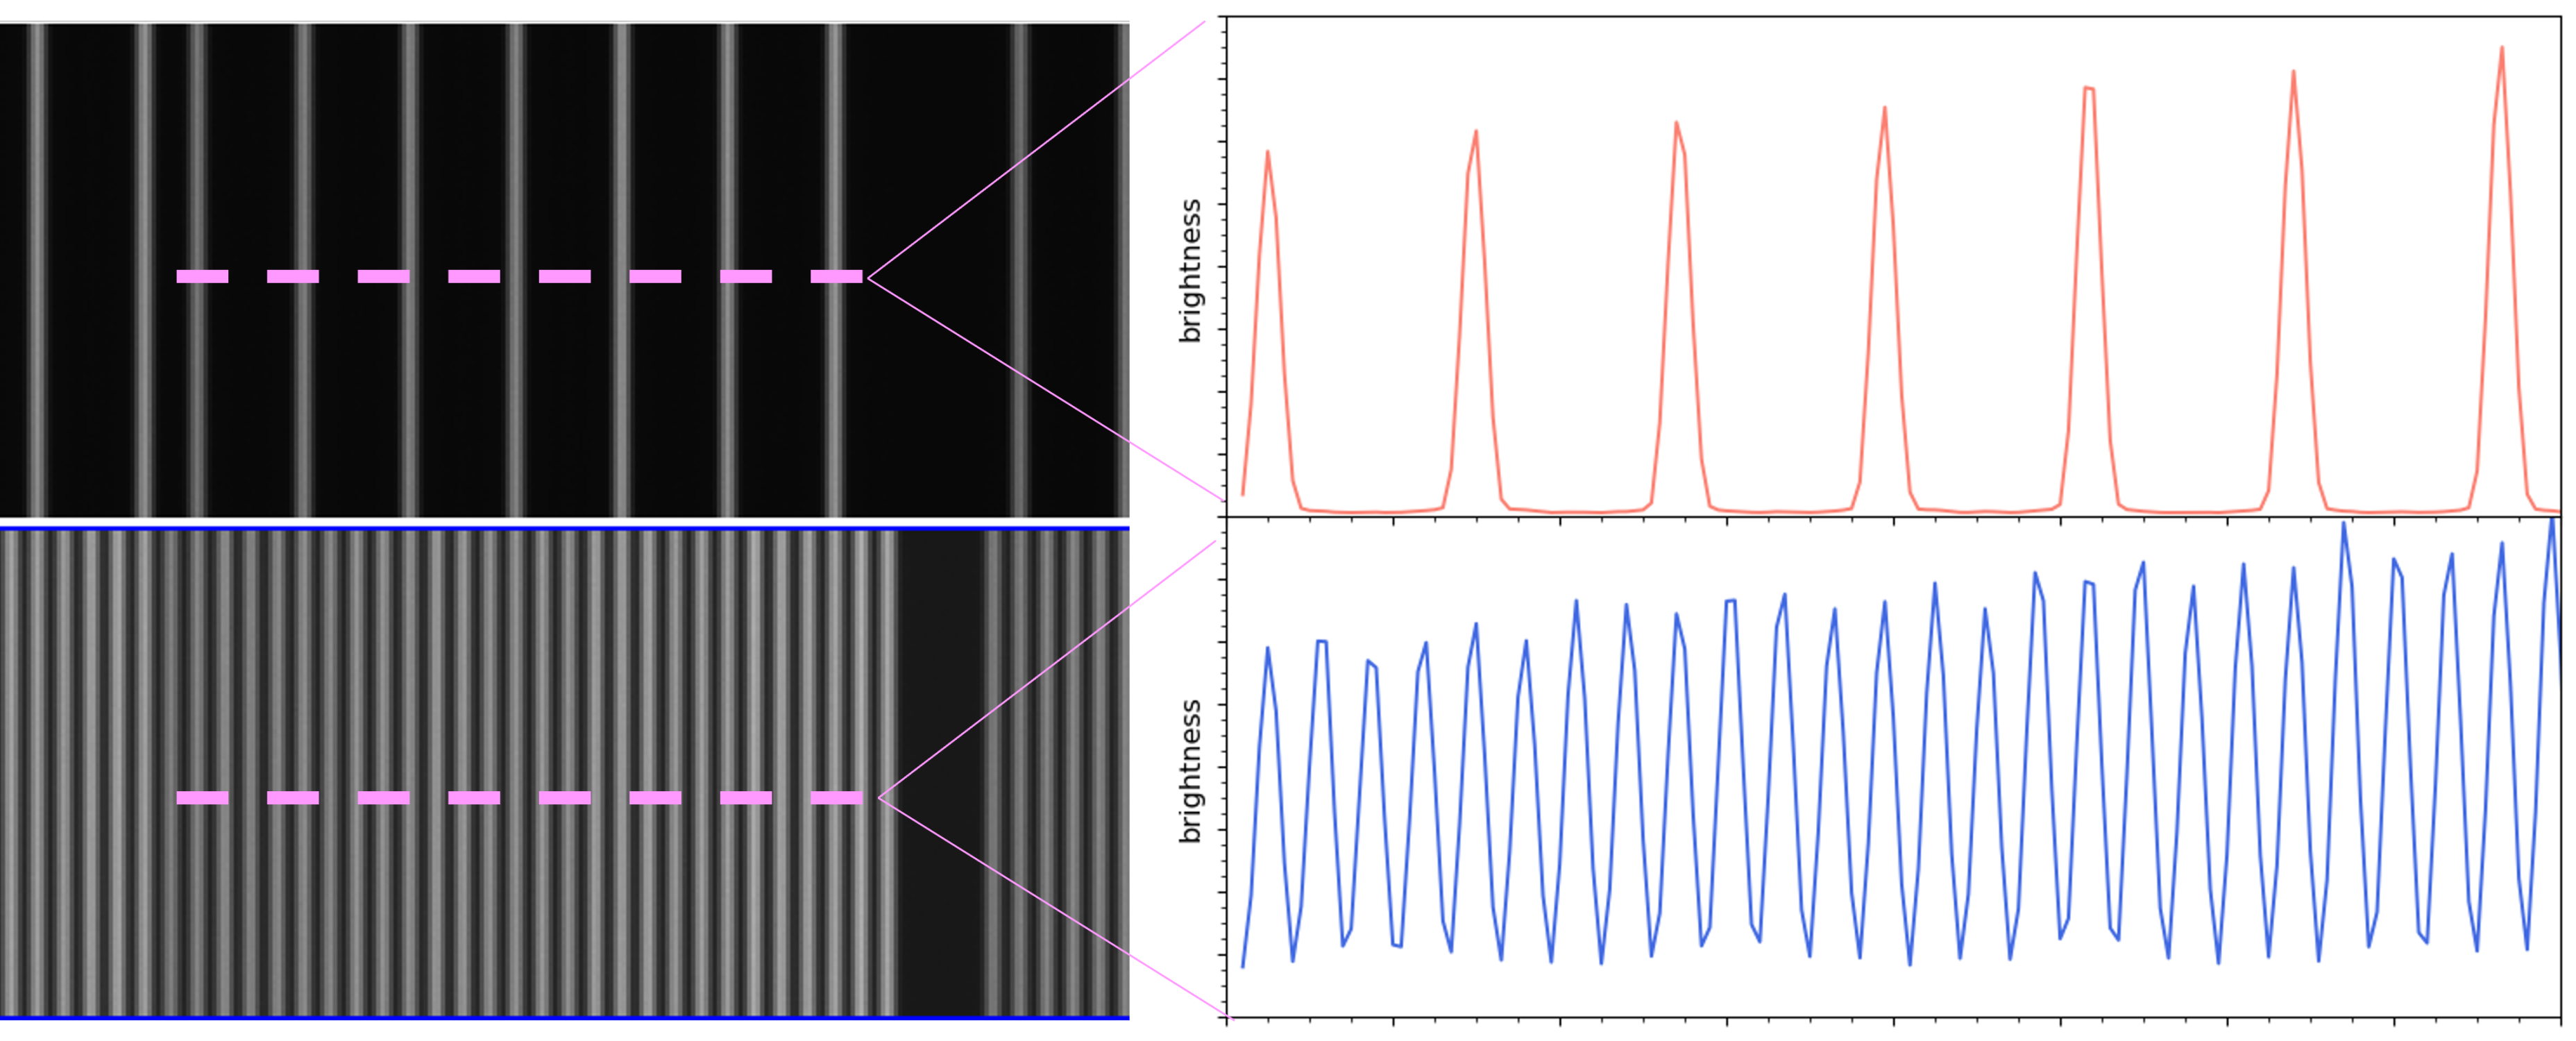
Actually the spectra are slightly overwrapped with each other, which makes it difficult to measure the fiber profile. The light from the neighboring fibers contaminates, especially the wings (blue line on lower panel in the above figure). To overcome this challenge, the 54mm-tick glass installed PFI has special coating called “dot”. Literally, the black dots obscure the light coming into / out of the fibers behind them.
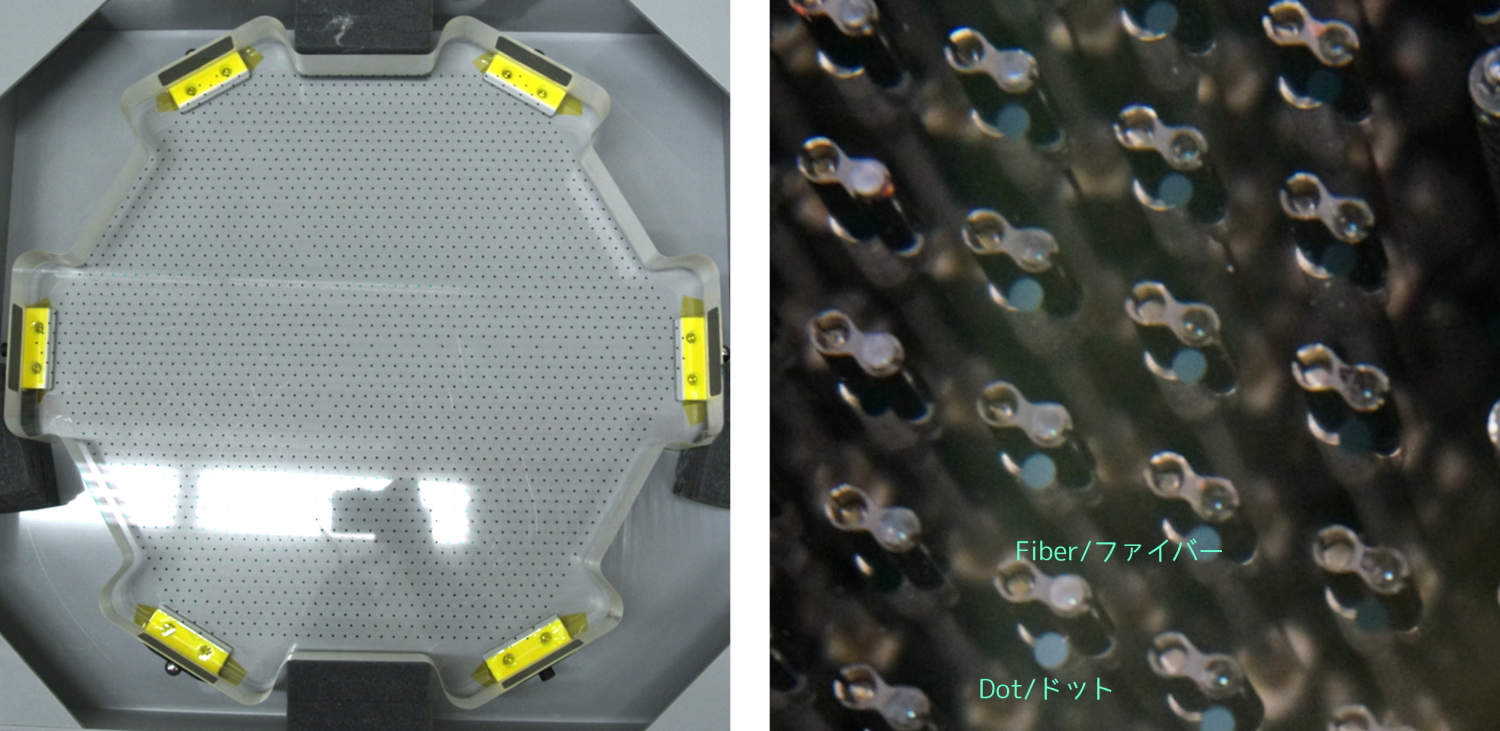
Right: Close look of the fibers and the dots.
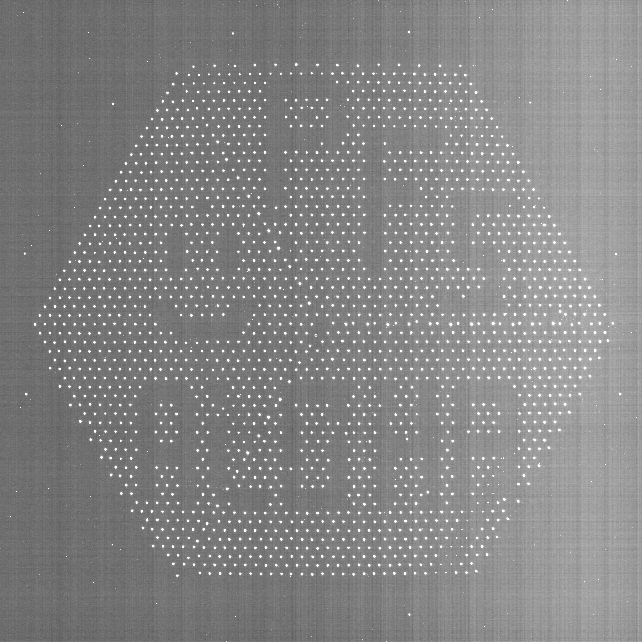
By thinning out the illuminated fibers, we can measure the individual fiber profiles carefully (red line in the upper panel of the above figure). To get the fiber behind the dots, we move the fiber positioners little by little by monitoring the brightness until the light is gone. For example, if we hide a part of fibers behind the dot, the metrology camera can take the below image.
It takes a lot of efforts and time, so taking calibration data now prior to the coming engineering observation gives us advantages to prepare for the on-sky tests.
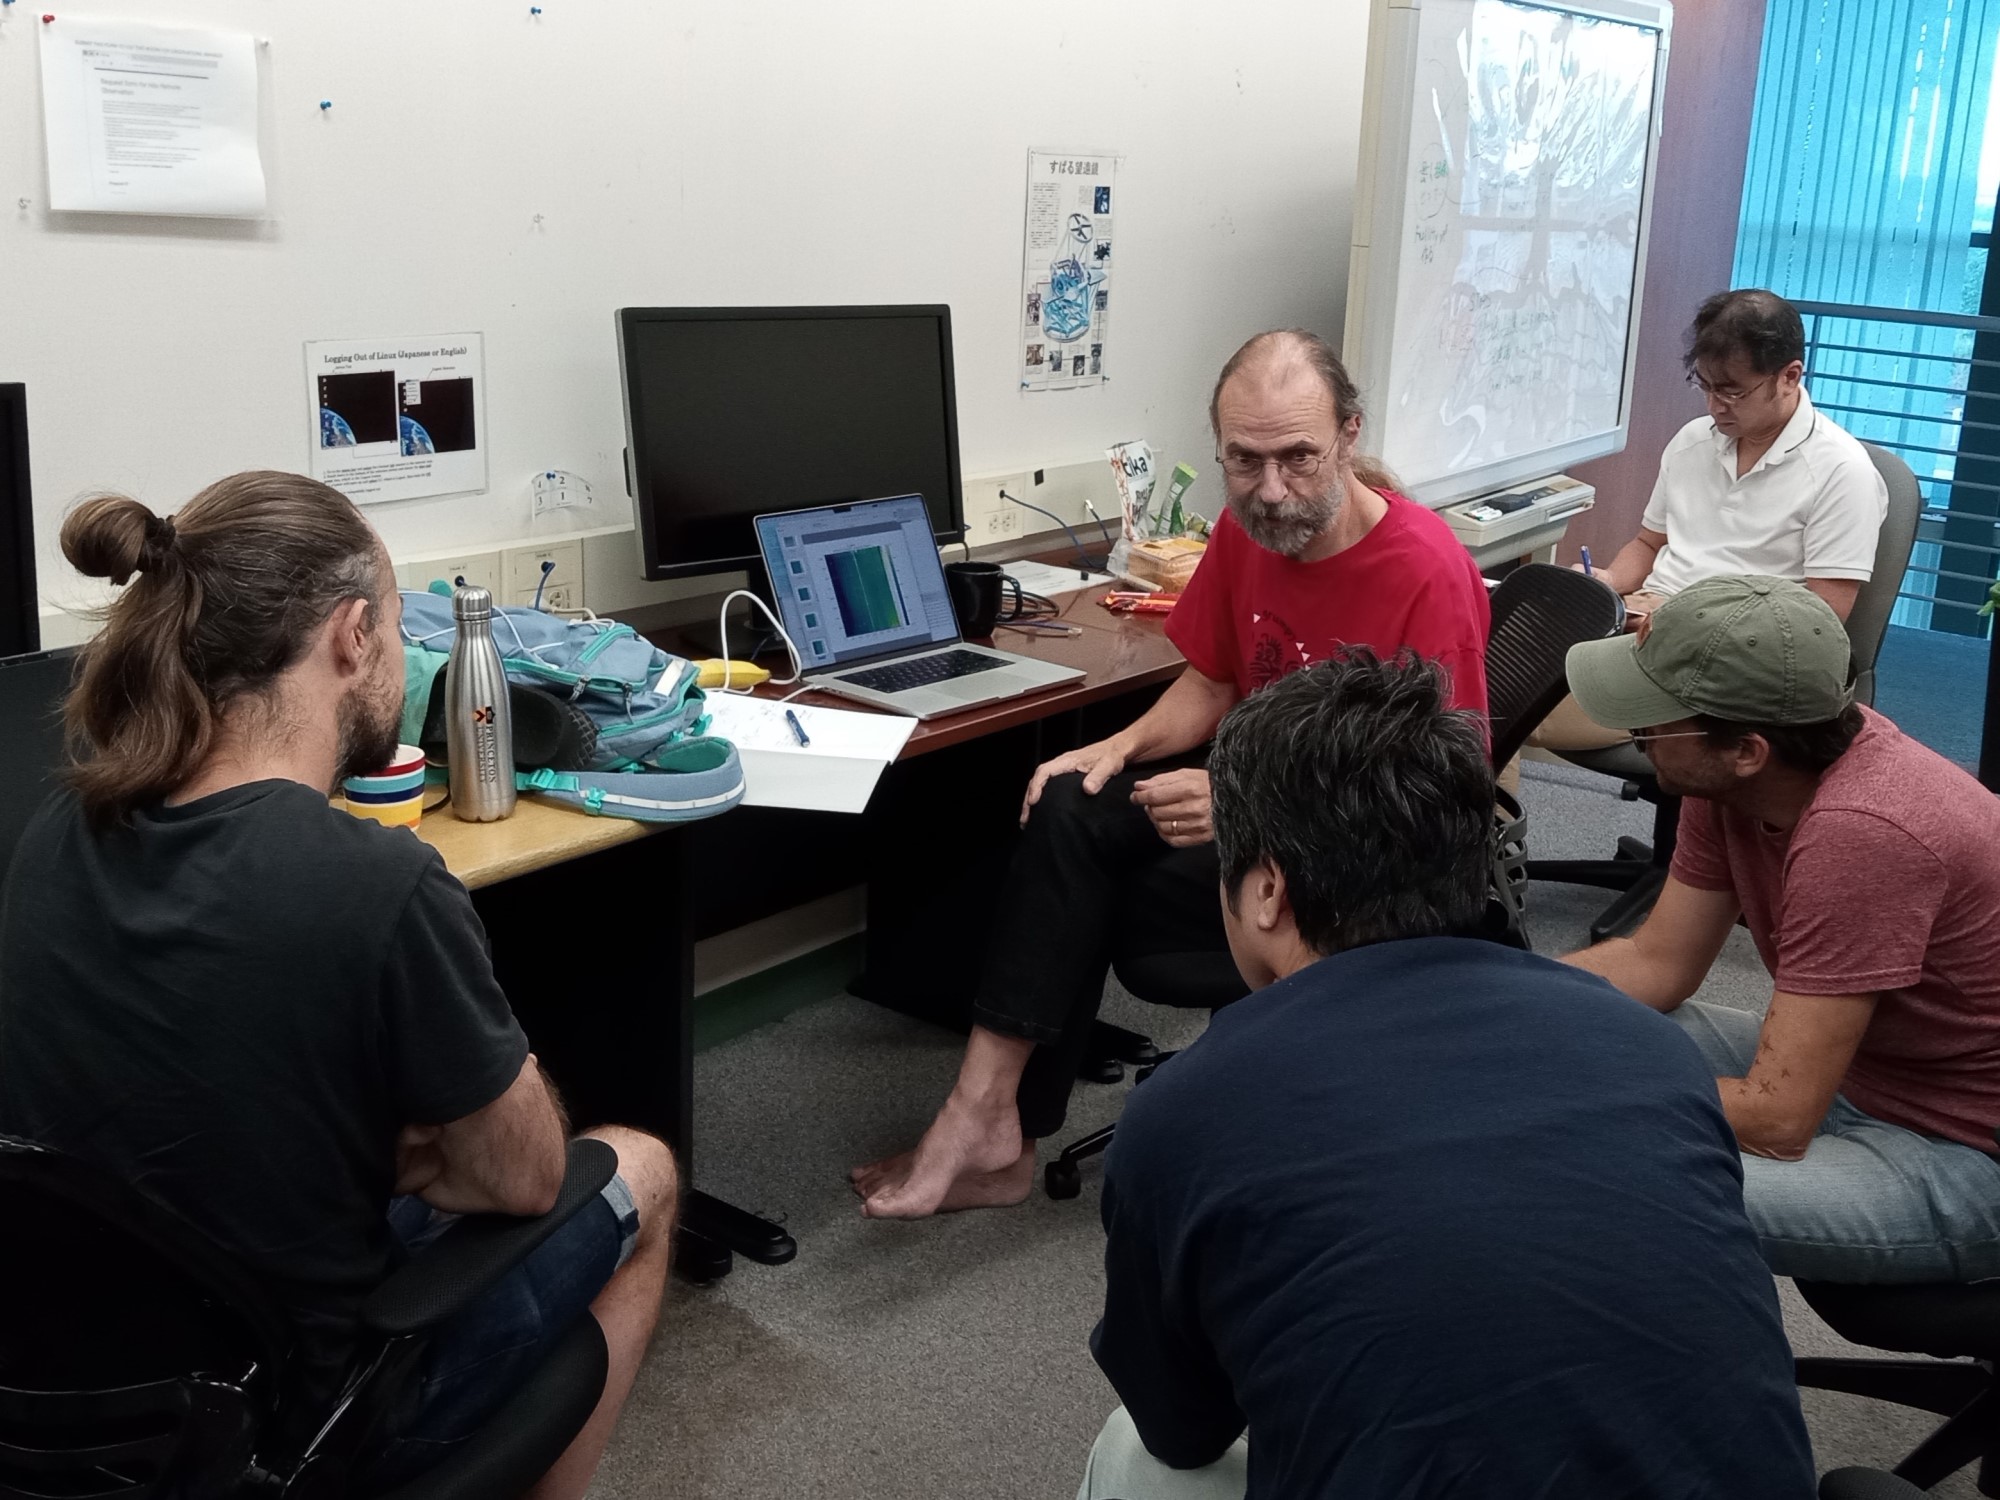
In addition to processing software, the software team develops tools to assess the quality of the data process. We have been discussing the tools at regular meetings and intensive conversations in person in order to process the data together with the quality assessment. By doing so, observers can get feedback quickly when there is a problem or concern.
Furthermore, during on-telescope test we also aimed at shortening process time to move the fibers onto the target position. It took 7minitues, which is about half of our nominal exposure time. In the last several months, the members from ASIAA (Taiwan) analyzed each process carefully to see if there are any processes to take long unnecessary, and improved such processed one by one. Thanks to these efforts, the duration to move the fibers has been shortened down to 2 minutes. This will help to observe huge number of celestial objects more efficiently.
We are developing and optimizing software as well as preparing hardware to complete the instruments.
[Note] In December 2023, Subaru telescope temporarily stopped observation due to the telescope trouble, but we carried out tests and data acquisition without moving telescope, thanks to kind arrangement by observatory.