PFS Expected Performance
The sensitivity information below is as of Jul. 2024, and may change in the future.
Basic Information
| Arm | Wavelength range | Throughput(1) | Resolving Power | Continuum sensitivity(2) | Emission line sensitivity(3) | |||
|---|---|---|---|---|---|---|---|---|
| [AB mag] | [10-17 erg/s/cm2] | |||||||
| [nm] | mean(4) | representative(5) | mean(4) | representative(5) | ||||
| Blue | 380 - 450 | 10% | ∼2500 | 21.8 | 21.9 (@415nm) | 4.6 | 4.3 (@415nm) | |
| 450 - 550 | 18% | 22.3 | 22.3 (@505nm) | 2.1 | 2.1 (@505nm) | |||
| 550 - 650 | 21% | 22.1 | 22.2 (@605nm) | 1.9 | 1.7 (@605nm) | |||
| Red | Low Res. | 630 - 750 | 27% | ∼3000 | 22.3 | 22.5 (@680nm) | 1.5 | 1.2 (@680nm) |
| 750 - 850 | 26% | 22.1 | 22.4 (@796nm) | 1.5 | 1.1 (@796nm) | |||
| 850 - 970 | 23% | 21.7 | 22.1 (@912nm) | 1.7 | 1.2 (@912nm) | |||
| Mid. Res. | 710 - 775 | 25% | ∼5500 | 21.7 | 21.9 (@741nm) | 1.5 | 1.3 (@741nm) | |
| 775 - 825 | 24% | 21.6 | 21.9 (@796nm) | 1.5 | 1.2 (@796nm) | |||
| 825 - 885 | 22% | 21.5 | 21.8 (@856nm) | 1.5 | 1.3 (@856nm) | |||
| NIR | 940 - 1050 | 21% | ∼4500 | 21.2 | 21.8 (@993nm) | 2.2 | 1.4 (@993nm) | |
| 1050 - 1150 | 19% | 21.1 | 21.5 (@1100nm) | 1.9 | 1.5 (@1100nm) | |||
| 1150 - 1260 | 14% | 20.8 | 21.2 (@1208nm) | 2.2 | 1.7 (@1208nm) | |||
Note: These estimates are based on the PFS exposure time calculator developed by C. Hirata arXiv:1204.5151 under the following assumptions:
- FWHM=0.8 arcsec seeing condition (the fraction of incoming flux to fiber aperture is ∼62% at the field center and ∼54% at the edge if the fiber is perfectly aligned with a stellar object)
- Observation at a zenith angle of 35 deg.
- Observation at a dark night
- Observation near the field edge (0.45 deg. from the center)
- No Galactic dust extinction
- Recent sky model provided by Jim Gunn
- Systematic sky subtraction error of 1%
- Diffused stray light on the detector originating from 2% of incoming sky flux
- Dark current [e-/pix/s] of 0.0002 (blue), 0.0001 (red), and 0.01 (NIR)
- Read-out noise [e-RMS/pix] of 4.0 (blue and red) and 4.0 (NIR)
(1) The total throughput including primary mirror reflectivity, WFC transmission, and PFS instrument. See here. The fiber aperture effect is not included because it depends on seeing condition and object type. The vignetting effect, ∼94% at the field center and ∼71% at the field edge, is not included either because it depends on the field position. The continuum and emission-line sensitivity information, however, are calculated taking these factors into consideration.
(2) Continuum sensitivity in case of a point source, to achieve S/N=5 for 1-hour on-source exposure (4×900 sec.), after 3 pixel binning.
(3) Emission-line sensitivity in case of an extended rouce (r_eff=0.3 arcsec.), to achieve S/N=5 for 1-hour on-source exposure (4×900 sec.). Here, the line width is assumed to be σ=70 km/s.
(4) The average limiting magnitude and line flux in the wavelength range. This value may be affected by the sky emission line.
(5) The representative value at the wavelength where the spectrum is not affected by the sky emission line.
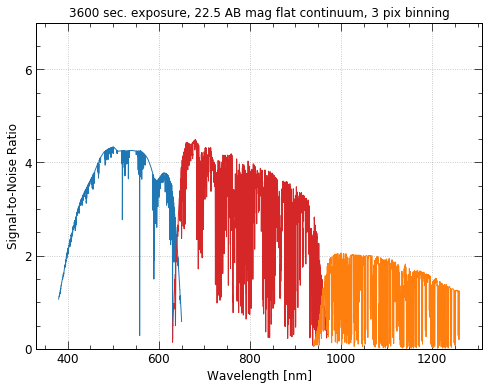
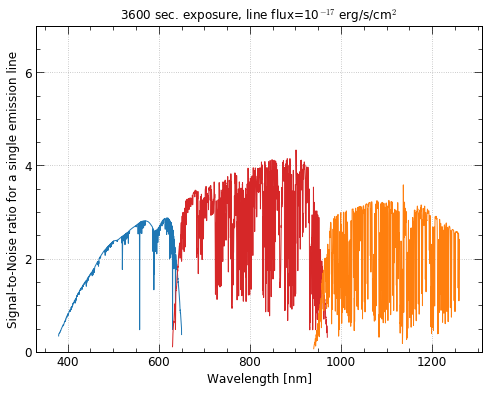
Fig. 1. S/N expected for continuum (left) and emission line (right) in case of the total on-source integration time of 1 hour. Flat continuum of 22.5 AB mag of a point source and line flux of 1 × 10-17 erg/s/cm2 of an extended source are assumed. For the red arm, only the low resolution result is shown.
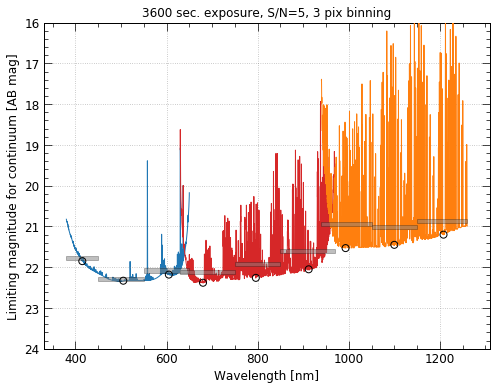
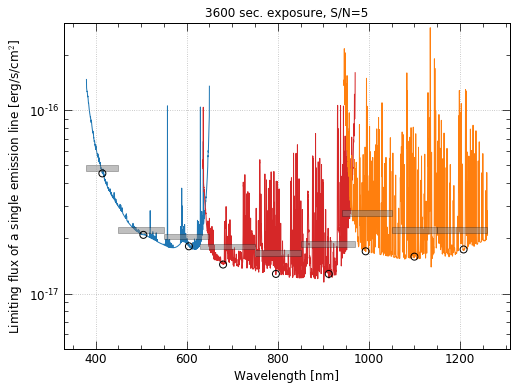
Fig. 2. Limiting magnitude for continuum of a point source (left) and limiting flux of a single emission line of an extended source (right) to achieve S/N=5 in case of the total on-source exposure time of 1 hour. The gray horizontal bar indicates the average value while the open circle shows the representative value in the specific wavelength range. For the red arm, only the low resolution result is shown.
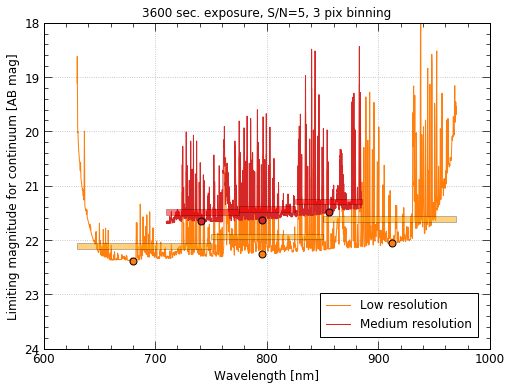
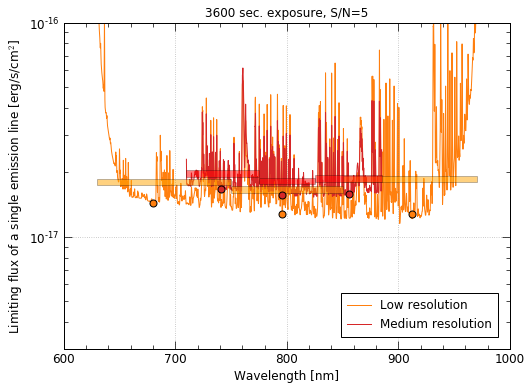
Fig. 3. A similar plot to Fig. 2, but for the medium resolution mode.
Moonlight Effects
Note: this study was done with ETC version 1.3. Moonlight effects are presented below. Using the PFS exposure time calculator (see above), the S/N of calculated for the 18.5--22.5 magnitude AB in case of 900-sec exposure time is compared among four cases: Night skys with new moon (moon phase 0.0), half moon (moon phase 0.25), 3 days after half moon (moon phase 0.375), and full moon (moon phase 0.5). By comparing to the case with new moon, degradation of SN with moonlight is calculated for various cases.
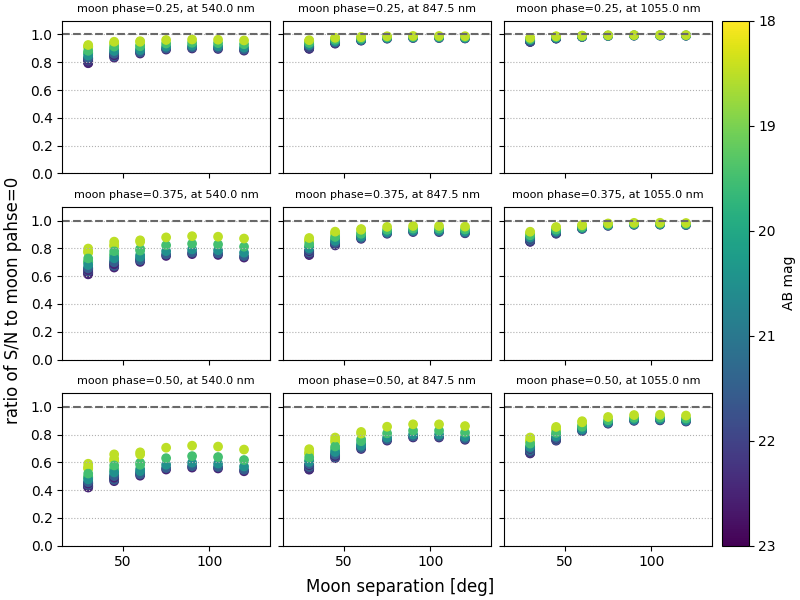
Fig.4. Comparison of S/N (for 900-sec exposure) to the new moon (moon phase=0) for continuum at 540.0 nm (left), 847.5 nm (middle), and 1055.0 nm (right), as a function of the separation angle between the object and the moon. From top to bottom, the case of half moon (moon phase 0.25), 3 days after half moon (moon phase 0.375), and full moon (moon phase 0.5) is displayed. The color indicates AB magnitude.